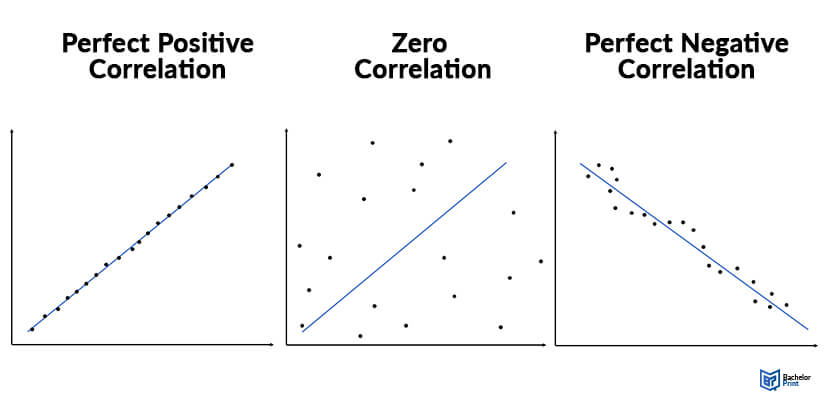
The correlation coefficient is a statistical measure that quantifies the degree to which two variables are related to each other. It is a key concept in statistics and is used widely in fields like social sciences, finance, and medicine. The correlation coefficient ranges from -1 to +1. A coefficient of +1 indicates a perfect positive correlation, a coefficient of -1, on the other hand, indicates a perfect negative correlation and a correlation of 0 implies no relationship. Learn more in this article.
Definition: The correlation coefficient
The correlation coefficient is a measure of the strength of the relationship between two variables. There are several types of correlation coefficients, but the most commonly used is Pearson’s (r).
| Correlation Coefficient | Meaning | Example |
| Between 0 and 1 | A positive relationship | Height and weight |
| 0 | No relationship at all | Amount of tea drunk and intelligence |
| Between 0 and -1 | A negative relationship | Height above sea level and temperature |
Understanding the correlation coefficient
This coefficient is used as inferential statistics, meaning it can be used to test statistical hypotheses. It also works as descriptive statistics and can be used to summarize findings in research.
Here are other names for this coefficient:
- Pearson’s r
- Pearson’s product-moment correlation coefficient (PPMCC)
- Bivariate correlation
Correlation coefficient: Graphical representation
The line of best fit is a line that goes through scatter plots of data points, and it helps to show the relationship between variables.
If the variables have a correlation coefficient of zero, it will not be possible to draw a line of best fit. If there is a perfect correlation between the two variables, you will get all points on the line of best fit.

When to use the correlation coefficient
You should use this coefficient in the following cases:
- When both variables are quantitative
- When the variables are normally distributed
- When the data has no outliers
- When the relationship between the variables is linear
Other types of correlation coefficients
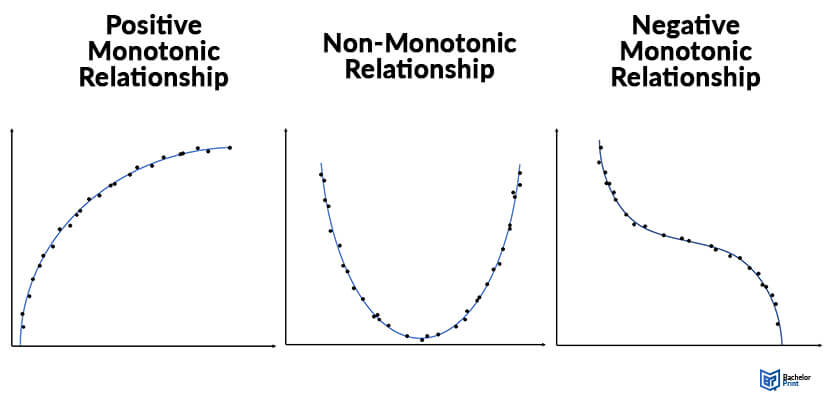
Spearman’s rank correlation coefficient can be used for monotonic relationships.
It is appropriate for measurements taken from ordinal scales. You should also use it if the variables aren’t normally distributed and if it includes outliers.

Calculating the correlation coefficient
You can calculate this value using a formula or software. Here is the formula used:
The following shows a sample of a dataset to demonstrate how the correlation coefficient can be calculated.
Step 1: x and y variables
The independent variable should be on the x-axis, while the dependent variable should be on the y-axis.
- In this case, age will be considered the x variable.
- The person’s income will be considered the y variable.
Step 2: x2 and y2
The first step is to square the x and y variables. This will give you the following values:
| Person 1 | x2 = 400; y2 = 2250000 |
| Person 2 | x2 = 900; y2 = 9000000 |
| Person 3 | x2 = 1600; y2 = 25000000 |
| Person 4 | x2 = 2500; y2 = 56250000 |
Step 3: Cross product and the sum
Next, you have to multiply x and y together. This will give you the following values:
| Person 1 | 30,000 |
| Person 2 | 90,000 |
| Person 3 | 200,000 |
| Person 4 | 375,000 |
Step 4: Calculate the correlation coefficient
You can add up the x values, y values, xy values, x2 values, and y2 values. You can now plug the numbers into the formula.
- This will give you a correlation coefficient of 0.9938.
That means age and income are strongly correlated.
Testing correlation coefficient significance
To determine whether the relationship between two variables is significant, you have to find the value of r and n, which is the sample size. Your goal is to determine whether Pearson’s correlation coefficient of the population (p) is significantly different from 0.
- Null hypothesis (H0): p = 0
- Alternative hypothesis (Ha): p ≠ 0
Aside from using the following steps, you can test the hypotheses using software like Stata. As an example, we will assume you have the following figures:
Step 1: Calculate the t-value
You can calculate the t-value using this formula:
By inputting the figures in our example, you will get .
Step 2: Find the critical value of t
You have to use a t table to find the critical value of t. You will need to determine the degrees of freedom (df) and significance level (a).
In most cases, two-tailed tests are preferred for correlations. In our example, the degree of freedom is 8, and the significance level is 0.5. Our critical value of t is 1.86.
Step 3: Compare t-value to critical value
For this step, you have to use the absolute value of t, meaning you should ignore any negative signs. Determine whether the t-value is higher or lower than the critical value of t.
Step 4: To reject or not to reject
If the absolute value of t is greater than the critical value, you will reject the null hypothesis. If it is less, you will fail to reject the null hypothesis.
In our example, we will reject the null hypothesis.
Reporting the correlation coefficient
In a research paper, the correlation coefficient is included in the results section. If you are using APA style, you should italicize “r“ and round the correlation coefficient to two decimal places.
The p-value should be rounded off to three decimal places. You also need to drop the leading 0 from these two values.
FAQs
This value is used to show how strongly related two variables are.
This means the two variables are not related at all.
In most cases, you will only test two variables.
A plus sign indicates that the variables have a positive correlation, while a minus sign shows that the variables have a negative correlation.

